THATCamp Melbourne April 1, 2011
Last week I attended THATCamp Melbourne, a humanities and technology ‘un-conference’, as well as its lead-up event, the Great PROV Data Challenge.
These events were attended by a diverse group that included humanities scholars, archivists, librarians, e-research support staff, and cultural hackers.

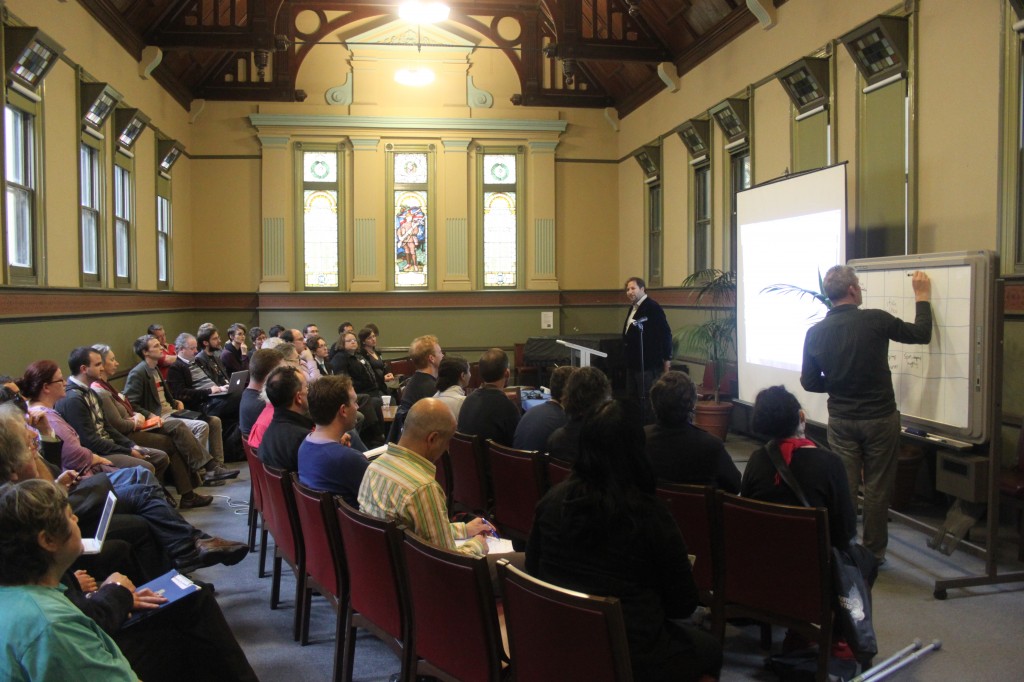
Opening Session of THATCamp Melbourne; people proposing sessions Photo: Craig Bellamy http://www.thatcampmelbourne.org/
A key theme that emerged at THATCamp was the importance of the data underlying the systems we design and use. By creating, managing, and publishing data in open formats we can create opportunities for the creative re-use of that information.
Spatio-temporal mapping
An example of such of creative re-use was presented by Matthew Coller in his session on spatio-temporal mapping. Matthew demonstrated SahulTime, an application that presents a spatial view of Australia (much like Google Earth) and combines this with a temporal scale that you can slide back to display historical information. Initially, SahulTime scaled back 100,000 years to display the rise and fall of sea levels around Australia. It has since broadened its scope to encompass much longer periods (including geological eras) as well as much shorter ones (it can be used to plot events in Australia’s recent history). Matthew now wants historical data to populate his system as it can be used to present many different kinds of events (archaeological finds, population movements, the development and collapse of civilisations, etc.).
Fun with Trove
Tim Sherratt demonstrated another use of historical data with his word frequency graphs for Australian newspapers. These graphs convey historical trends visually, for example by charting the frequency of floods or the relative popularity of tea and coffee. Tim’s work shows what is possible if historians are given direct access to the data underlying institutional websites. In order to create his graphs he hacked together his own API (application programming interface) to the National Library of Australia’s Trove Newspaper site.
Linking up the Dictionary of Sydney
Steven Hayes led a session that explored the possibilities of linking the personalities that appear in Dictionary of Sydney entries to the bibliographical data available at the National Library of Australia’s People Australia site. The Dictionary of Sydney approaches this goal from a good base since its entries are already coded in TEI (Text Encoding Initiative) XML markup. People and organisations named in the the Dictionary of Sydney can therefore be identified and linked using TEI markup. Steven hopes to do this automatically by using a tool such as GATE which can automatically identify entities within texts.
Text Encoding Initiative (TEI)
In this bootcamp session, Conal Tuohy introduced the TEI markup language. TEI has been in use for almost two decades and defines an XML markup for creating machine-readbable texts. It has been mainly used in the humanities for online presentation, to enable the ‘mining’ of texts in research projects, and for preservation. For archives, it has great potential as a language for marking up record items, including digitised records (it allows digitised images to be linked to transcribed text).
Building online collections (Omeka)
Tim Sherratt ran an interactive bootcamp session that guided us through the installation and creation of an online collection using the Omeka digital publishing suite. Omeka targets academics and the GLAM sector and can be used to provide access to collections online and to create digital galleries. Tim emphasised the importance of Omeka’s plug-ins which greatly extend its functionality. The relations plug-in, for example, allows you to create relationships between Omeka’s ‘items’ (which would allow you to link a record item to a record series). Other plug-ins allow bulk importing (e.g. of CSV or EAD files) and geo-spatial mapping of items.
The Great PROV Hack Challenge
This event immediately preceded THATCamp and was held at the Public Record Office Victoria (PROV). Three teams formed on the day to mash-up a series of datasets released by PROV. ‘The Grave Diggers’ team plotted PROV maps of the Old Melbourne Cemetery in Google Maps to show how the old cemetery was displaced by the Queen Victoria Market car park. ‘The Kelly Gang’ took a timeline of Kelly Gang sightings and robberies from a Royal Commission report and plotted these in space and time in Google, giving a visual picture of the gang’s movements. The third team, ‘the Otway Rangers’ overlayed geo-referenced parish maps on top of Google Maps and created an interactive database using Otway land selection data. All three teams proved how, with access to archival datasets, developers can create new applications and visualisations of history.
Data.records.nsw.gov.au
State Records NSW recently commenced its own project to identify datasets relating to the NSW State Archives collection and publish them in accessible ways. Data published in this way could spark new interfaces to the collection, create new possibilities for federated searching, or allow creative re-purposing such as in visualisations or in applications such as The History Wall.
As a first step, State Records NSW is publishing data from its online catalogue, Archives Investigator. This data is available under a Creative Commons license and can be downloaded from http://data.records.nsw.gov.au.


Leave a Reply
You must be logged in to post a comment.